
How We Cut 20 Hours from a Marketer’s Weekly Routine
Marketing Agency

- Problem: 6 ad accounts → 4 hours of manual export to cross-reference identical campaigns across different platforms.
- Goal: A single dashboard that shows ad performance in seconds.
- Priority: Accurate analytics in one window, with the potential to expand the product into a SaaS after internal testing.
- Timeline: 10 weeks for MVP, immediately testing with our own 1 million events/day.
- Result: Report built in 30 seconds. Ability to connect new platforms.
Learn how an internal "crutch" turned into a SaaS product – API adapters, metric normalization, caching, Vue frontend + Laravel backend.
Request a consultation
Our PR managers will analyze your problem and suggest solutions.
What Marketers Gained
The client received one analytical dashboard instead of 6 accounts – Google Ads, Facebook Ads, TikTok Ads, AdMob, Pangle, and AppMetrica. Metrics are already converted to a single currency, time zone, and campaigns are automatically matched. Identifying where a lead comes from takes less than 30 seconds. No need to switch between dozens of tabs – all key metrics in one place.
| Node and Purpose | Output |
|---|---|
| API Adapters – 6 ready connectors | Quickly add new data sources |
| Unified API + Database – normalizes currency, field names | Get clean, comparable metrics |
| Campaign Match Engine – cross-reference by internal IDs | One graph – one campaign. See its performance across platforms. |
| Vue Interface – render in < 500 ms | "Date-Source-Campaign" filter – no lags |
| Laravel Backend – 1 million events/day, horizontal scaling | Handle high loads – no crashes with traffic growth. |
API Adapters – 6 ready connectors
Quickly add new data sources
Unified API + Database – normalizes currency, field names
Get clean, comparable metrics
Campaign Match Engine – cross-reference by internal IDs
One graph – one campaign. See its performance across platforms.
Vue Interface – render in < 500 ms
"Date-Source-Campaign" filter – no lags
Laravel Backend – 1 million events/day, horizontal scaling
Handle high loads – no crashes with traffic growth.

Auto-update data — no exports or Excel summaries. Analysts open their browser and immediately see fresh KPIs.
Three Main Issues and How We Solved Them
| Problem | What We Did | What the Marketer Gained |
|---|---|---|
| 1. Google calculates CTR one way, TikTok another; currencies fluctuate from $ to € to ₽, time zones diverge. It took half a day of Excel routine to consolidate metrics. |
Created a normalization layer:
|
Opened the dashboard – all campaigns are already in one standard. "Honest" comparison of channels takes seconds, not hours. Connecting a new platform takes 1–2 days. |
| 2. Google Ads calls a campaign Spring_Sale, TikTok – spring-sale-TTK, Facebook – its own version. Consolidating results and understanding where a lead is cheaper could only be done manually. |
The match-ID algorithm unifies all variations under one internal code. In the dashboard:
|
The platform automatically matches campaigns by internal ID. Immediately see where clicks, lead cost, and conversion are higher. |
| 3. The system "crashes" on large data sets. Marketers built selections by dates, channels, and historical data. Queries overloaded the DB – waiting took minutes. |
Implemented a two-stage scheme:
|
|
1. Google calculates CTR one way, TikTok another; currencies fluctuate from $ to € to ₽, time zones diverge. It took half a day of Excel routine to consolidate metrics.
Created a normalization layer:
- 6 APIs → a single metric schema, one currency, one time zone.
- Automatic renaming of CPC, CTR, Cost fields.
- A new ad network connects in 1–2 days without changing the core.
Opened the dashboard – all campaigns are already in one standard. "Honest" comparison of channels takes seconds, not hours.
Connecting a new platform takes 1–2 days.
2. Google Ads calls a campaign Spring_Sale, TikTok – spring-sale-TTK, Facebook – its own version. Consolidating results and understanding where a lead is cheaper could only be done manually.
The match-ID algorithm unifies all variations under one internal code. In the dashboard:
- one campaign – one graph,
- sources highlighted by color.
The platform automatically matches campaigns by internal ID. Immediately see where clicks, lead cost, and conversion are higher.
3. The system "crashes" on large data sets. Marketers built selections by dates, channels, and historical data. Queries overloaded the DB – waiting took minutes.
Implemented a two-stage scheme:
- Raw data cache. Data flow is immediately written to a "raw" table and aggregated hourly.
- Background tasks. When a manager requests an analytical report, a background task is launched. After the report is generated, the system that it’s ready.
- The interface responds in < 0.5 s even with 1 million events/day.
- Deep analytics are built without lags and don't "crash" the server.
- You can run any slices and calmly move on to campaign optimization, without waiting for the screen to load.
Results
- Reduced analytics time from hours to seconds.
- 6 advertising platforms connected in a single window.
- Comparison of a single campaign across different platforms – in one graph.
- Processing up to 1 million events per day without performance loss.
- Ready for scaling as SaaS.
What's Next – And How It Can Help You
The platform has passed "combat tests" on our campaigns. The next stage is release as SaaS with a module for:
- Automatic KPI alerts → you notice dips before the budget drains;
- CPL/ROAS forecast based on history → plan purchases for the quarter ahead;
- Connectors to Power BI and Looker → pull data where your analytics operate.
Request a demo and discuss a pilot
We are ready to onboard the first external users and fine-tune it to your metrics.
Other projects

VPUT is an aggregator for apartment rentals in Bulgaria. Over a dozen people worked on this project, with an overall investment of 300,000 euros. This rental property database currently features 2,200 units.

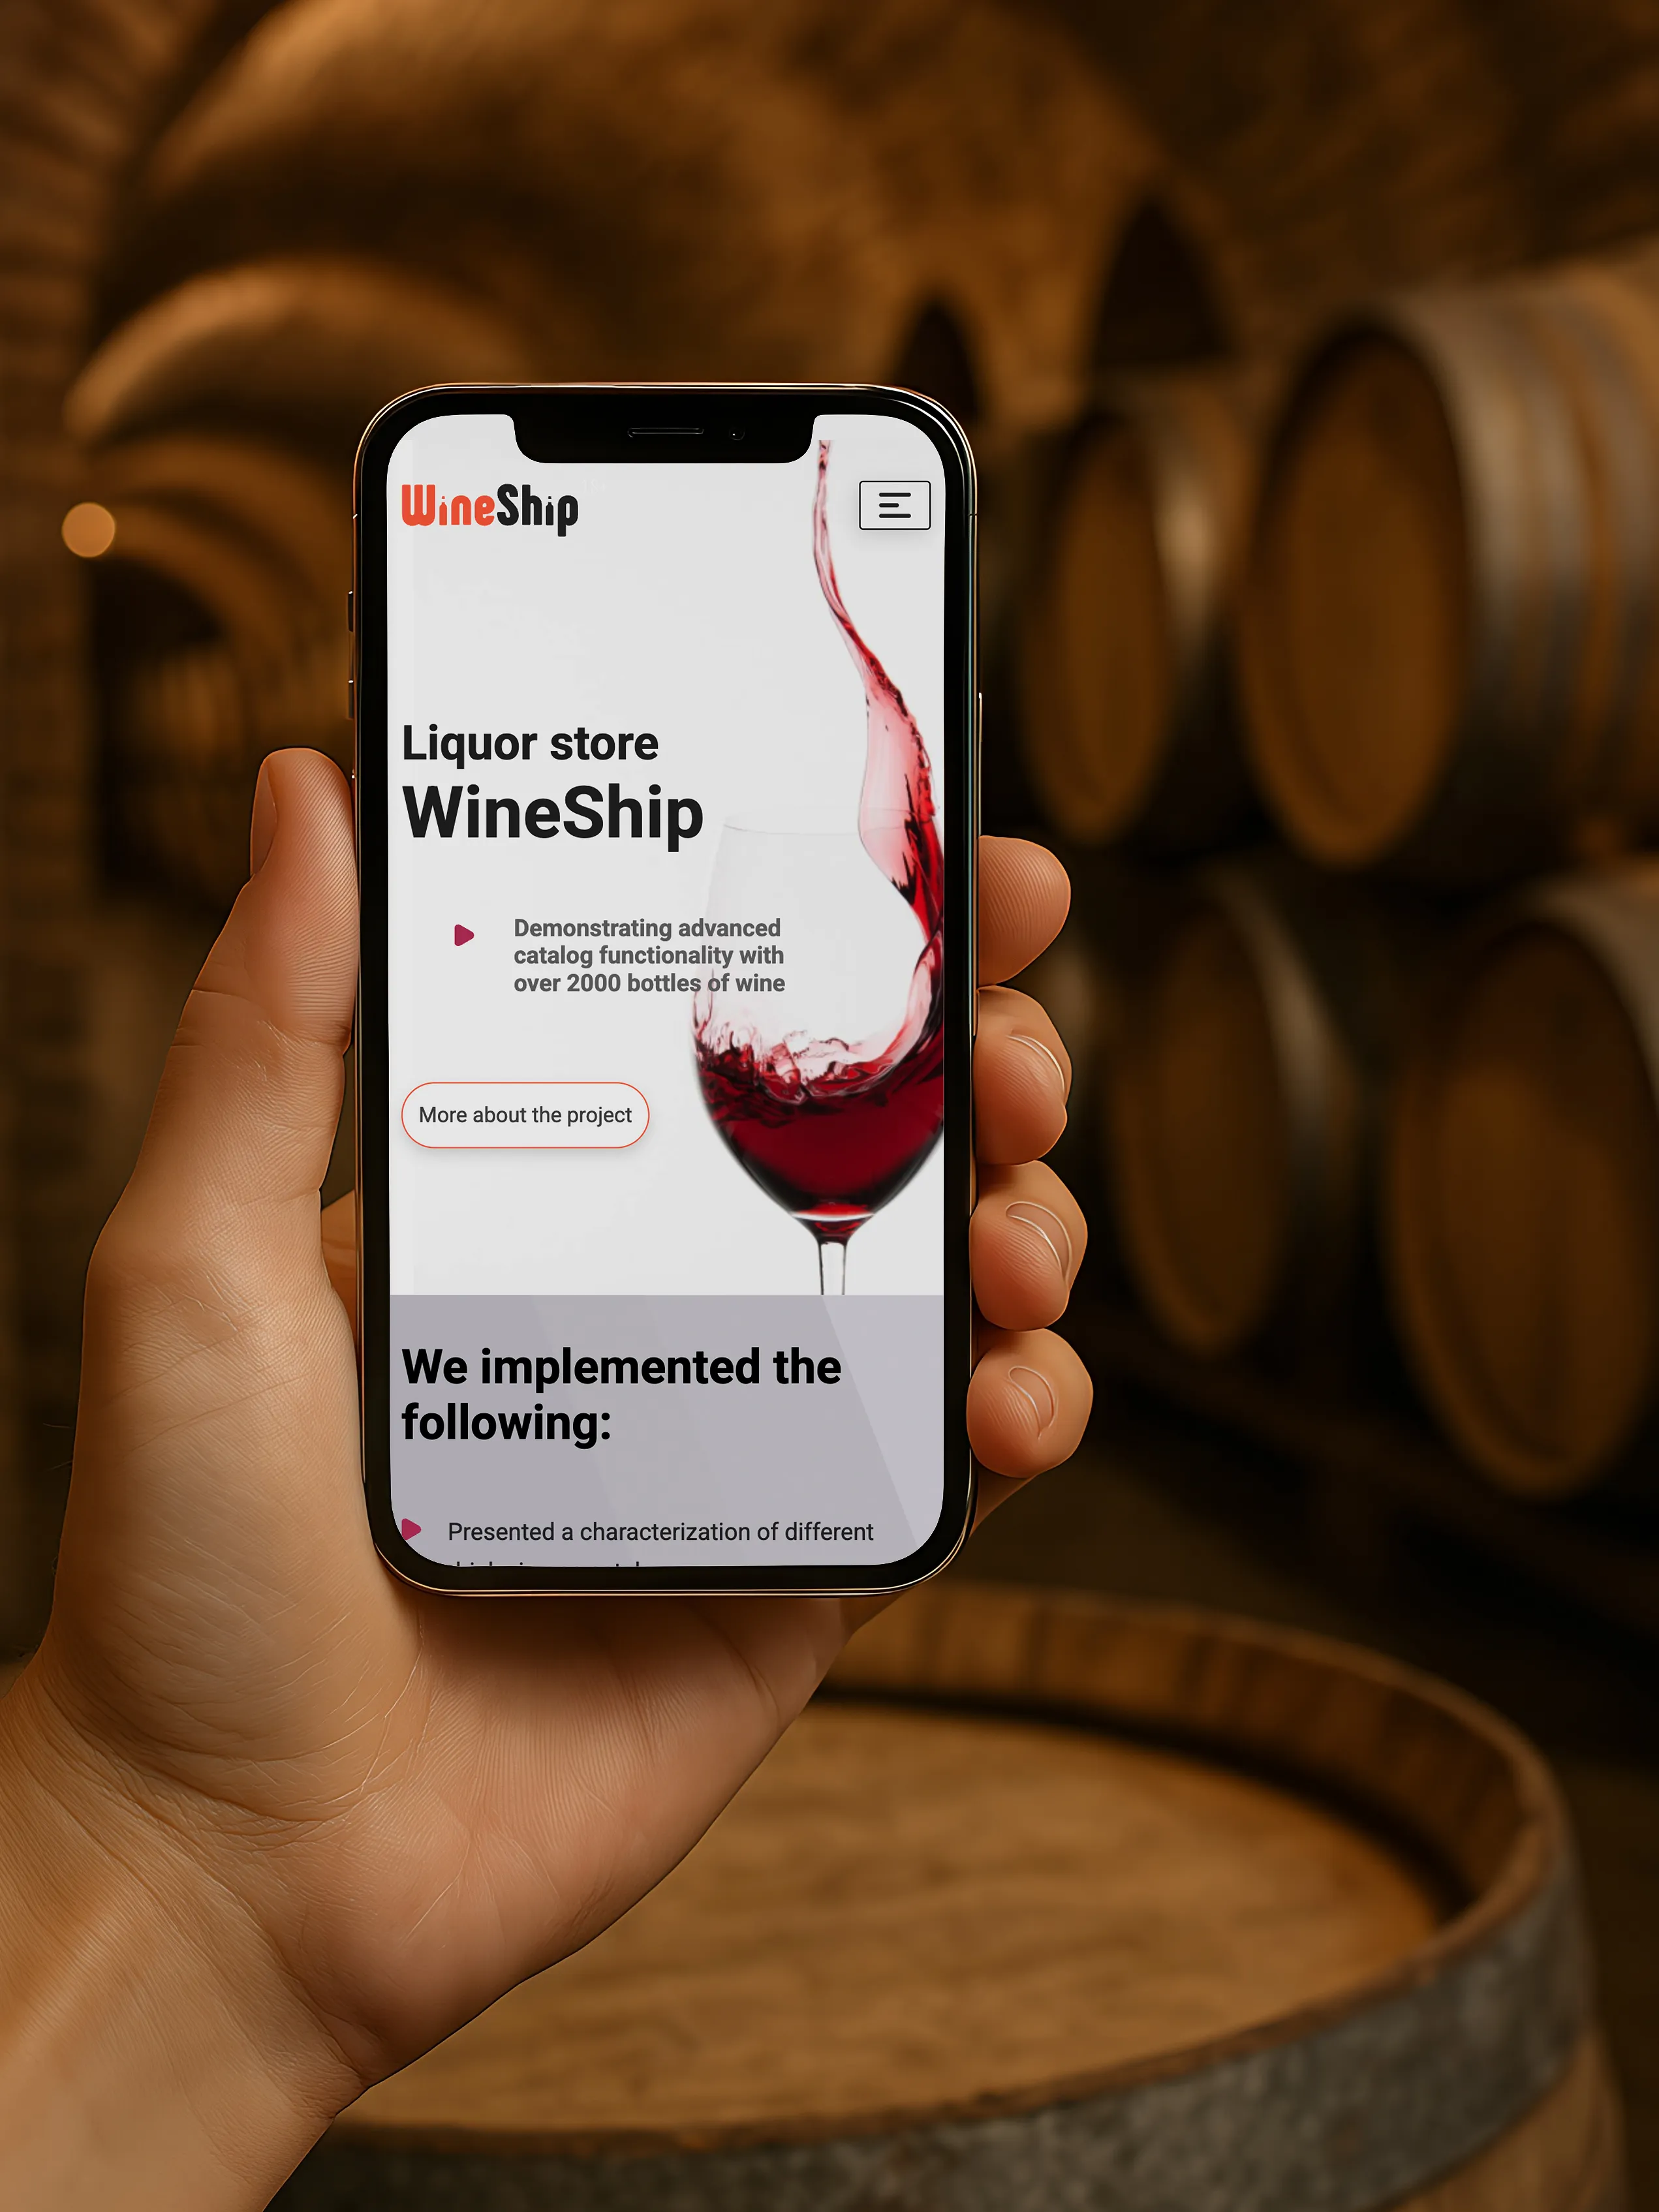
WineShip Liquor Store – advanced catalog functionality with over 2,000 bottles of wine.
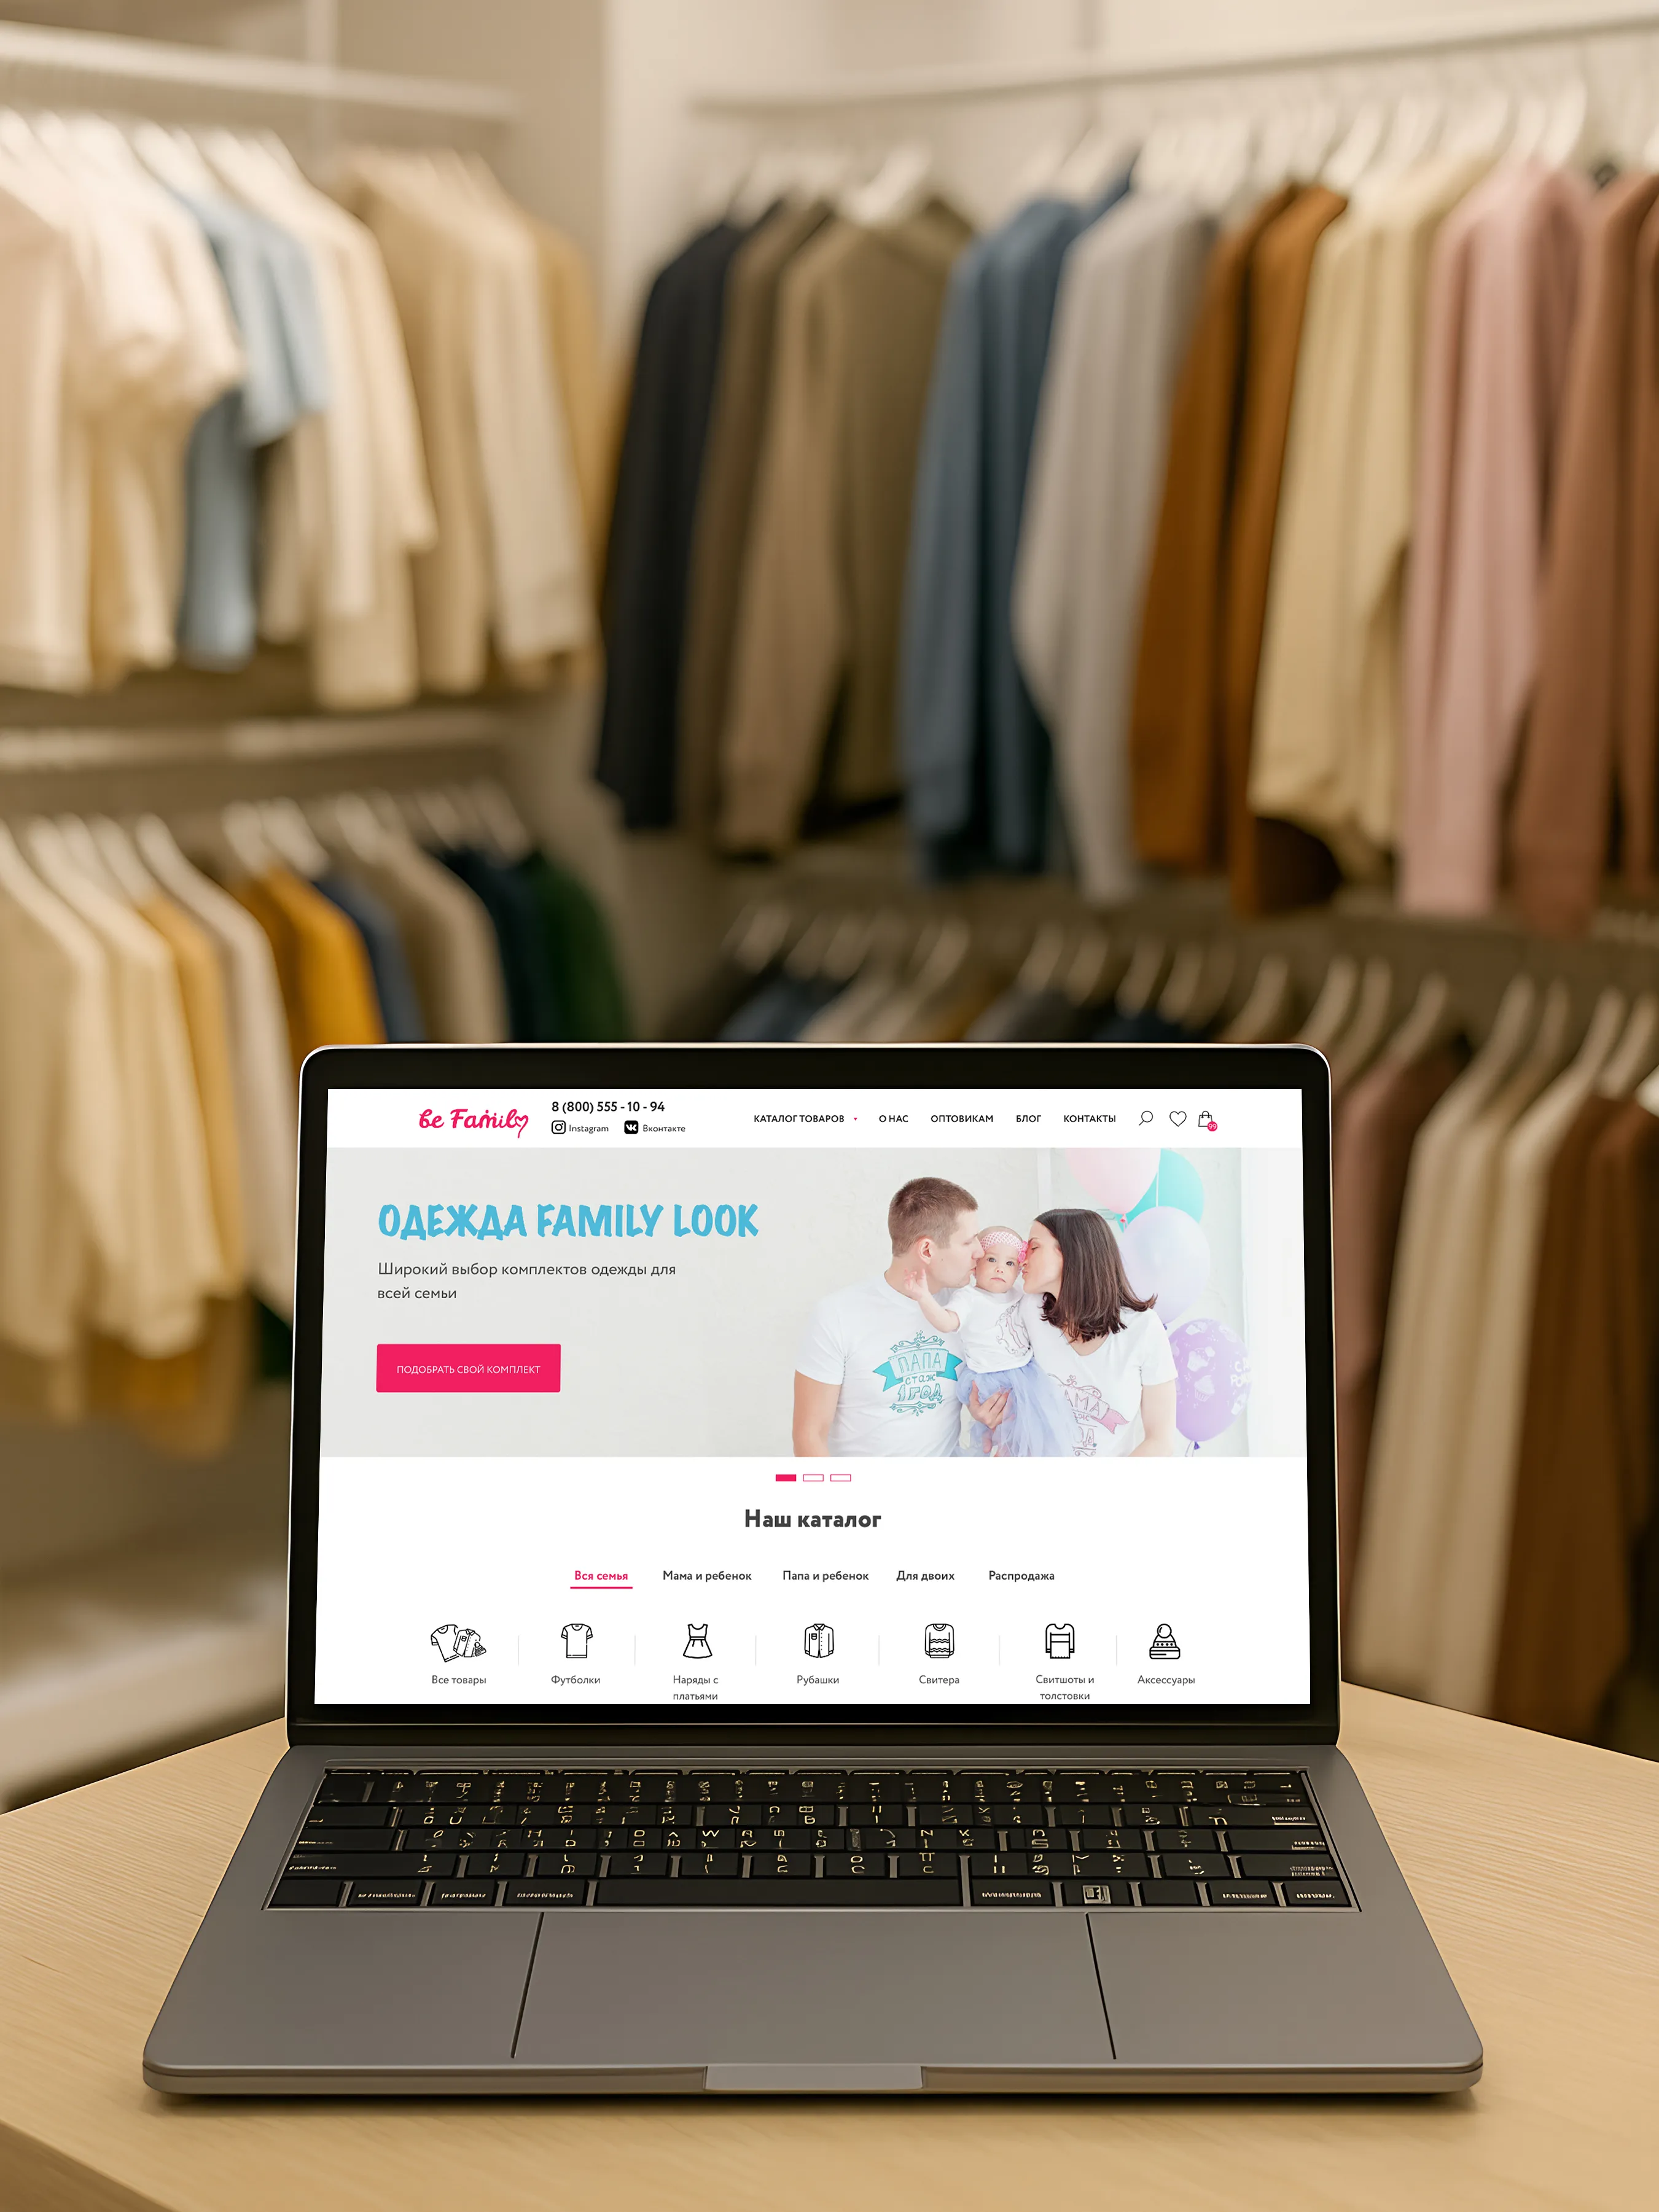
We developed a family clothing online store, optimizing the catalog, design, and user experience, boosting sales with SEO and usability improvements.

A modern site for selling elite, handmade carpets. Our main goal was to create a user-friendly, trustworthy website.

Successful launch of the RiseX cryptocurrency exchange from scratch – in just 7 months. The project involved 5+ people.

Bolgarskiy Dom is an aggregator for apartment sales in Bulgaria. Over 10 of our people worked on launching this project, creating a database of 5,000 apartments (as of 2024).

Neweurofences.com is an online store specializing in metal fences and gates. It operates in the USA, with delivery available to other countries.
Webdelo recently worked with a brand new dental office in a highly competitive market. We started with a limited budget, and this was one of our first projects in the USA. Read more to learn how we approached this project.
Solea Wellness is a beauty and health salon in Miami offering rejuvenation treatments. The client came to us with the request to increase the website's visibility in search results and attract new customers. The project started with zero rankings, which required a comprehensive approach to promotion and development.

🔹 As a salon in Miami increased applications by 3 times and organic traffic by 250% 🔹 From 0 to 180+ requests in TOP-3: real business growth case

Case study of the development and promotion of an online optical store. Over 10 people worked on this project, creating a catalog with over 10,000 individual items.

Our case study of Svetlanadental.com explores Webdelo’s work in the promotion and website development of a dental office located in south Florida, USA. This establishment is owned by a doctor with extensive experience in her field, and numerous awards.
Advanced Dental Wellness Center is a dental office in Miami, Fort Lauderdale. ADW offers holistic dentistry with a unique approach to treatment.
Migrated MyMoneyArt to WordPress, optimized SEO & UX: +500% traffic, 6× more leads.
Biomilk is a food distributor in Moscow and the regions. +100% organic traffic in 3 months, 200 keywords in the top 10 of Yandex and Google.

Promotion of VIP Dentistry in Manhattan, New York City From 13 to 80 Queries in Google’s Top 10 in Six Months

Mates China is a digital marketing agency that helps businesses promote their products in China through local social networks and marketplaces, including: WeChat, Weibo, Baidu, Douyin, LRB, and others. We helped their team increase traffic by 12 times over a period of 7 months.

How We Built a Vacation Rental Service in Bulgaria and Reached 1,500 Seasonal Bookings – From Idea to Full-Scale Product with SEO and Marketing

Online service with automatic price calculation and +40% orders right after launch.

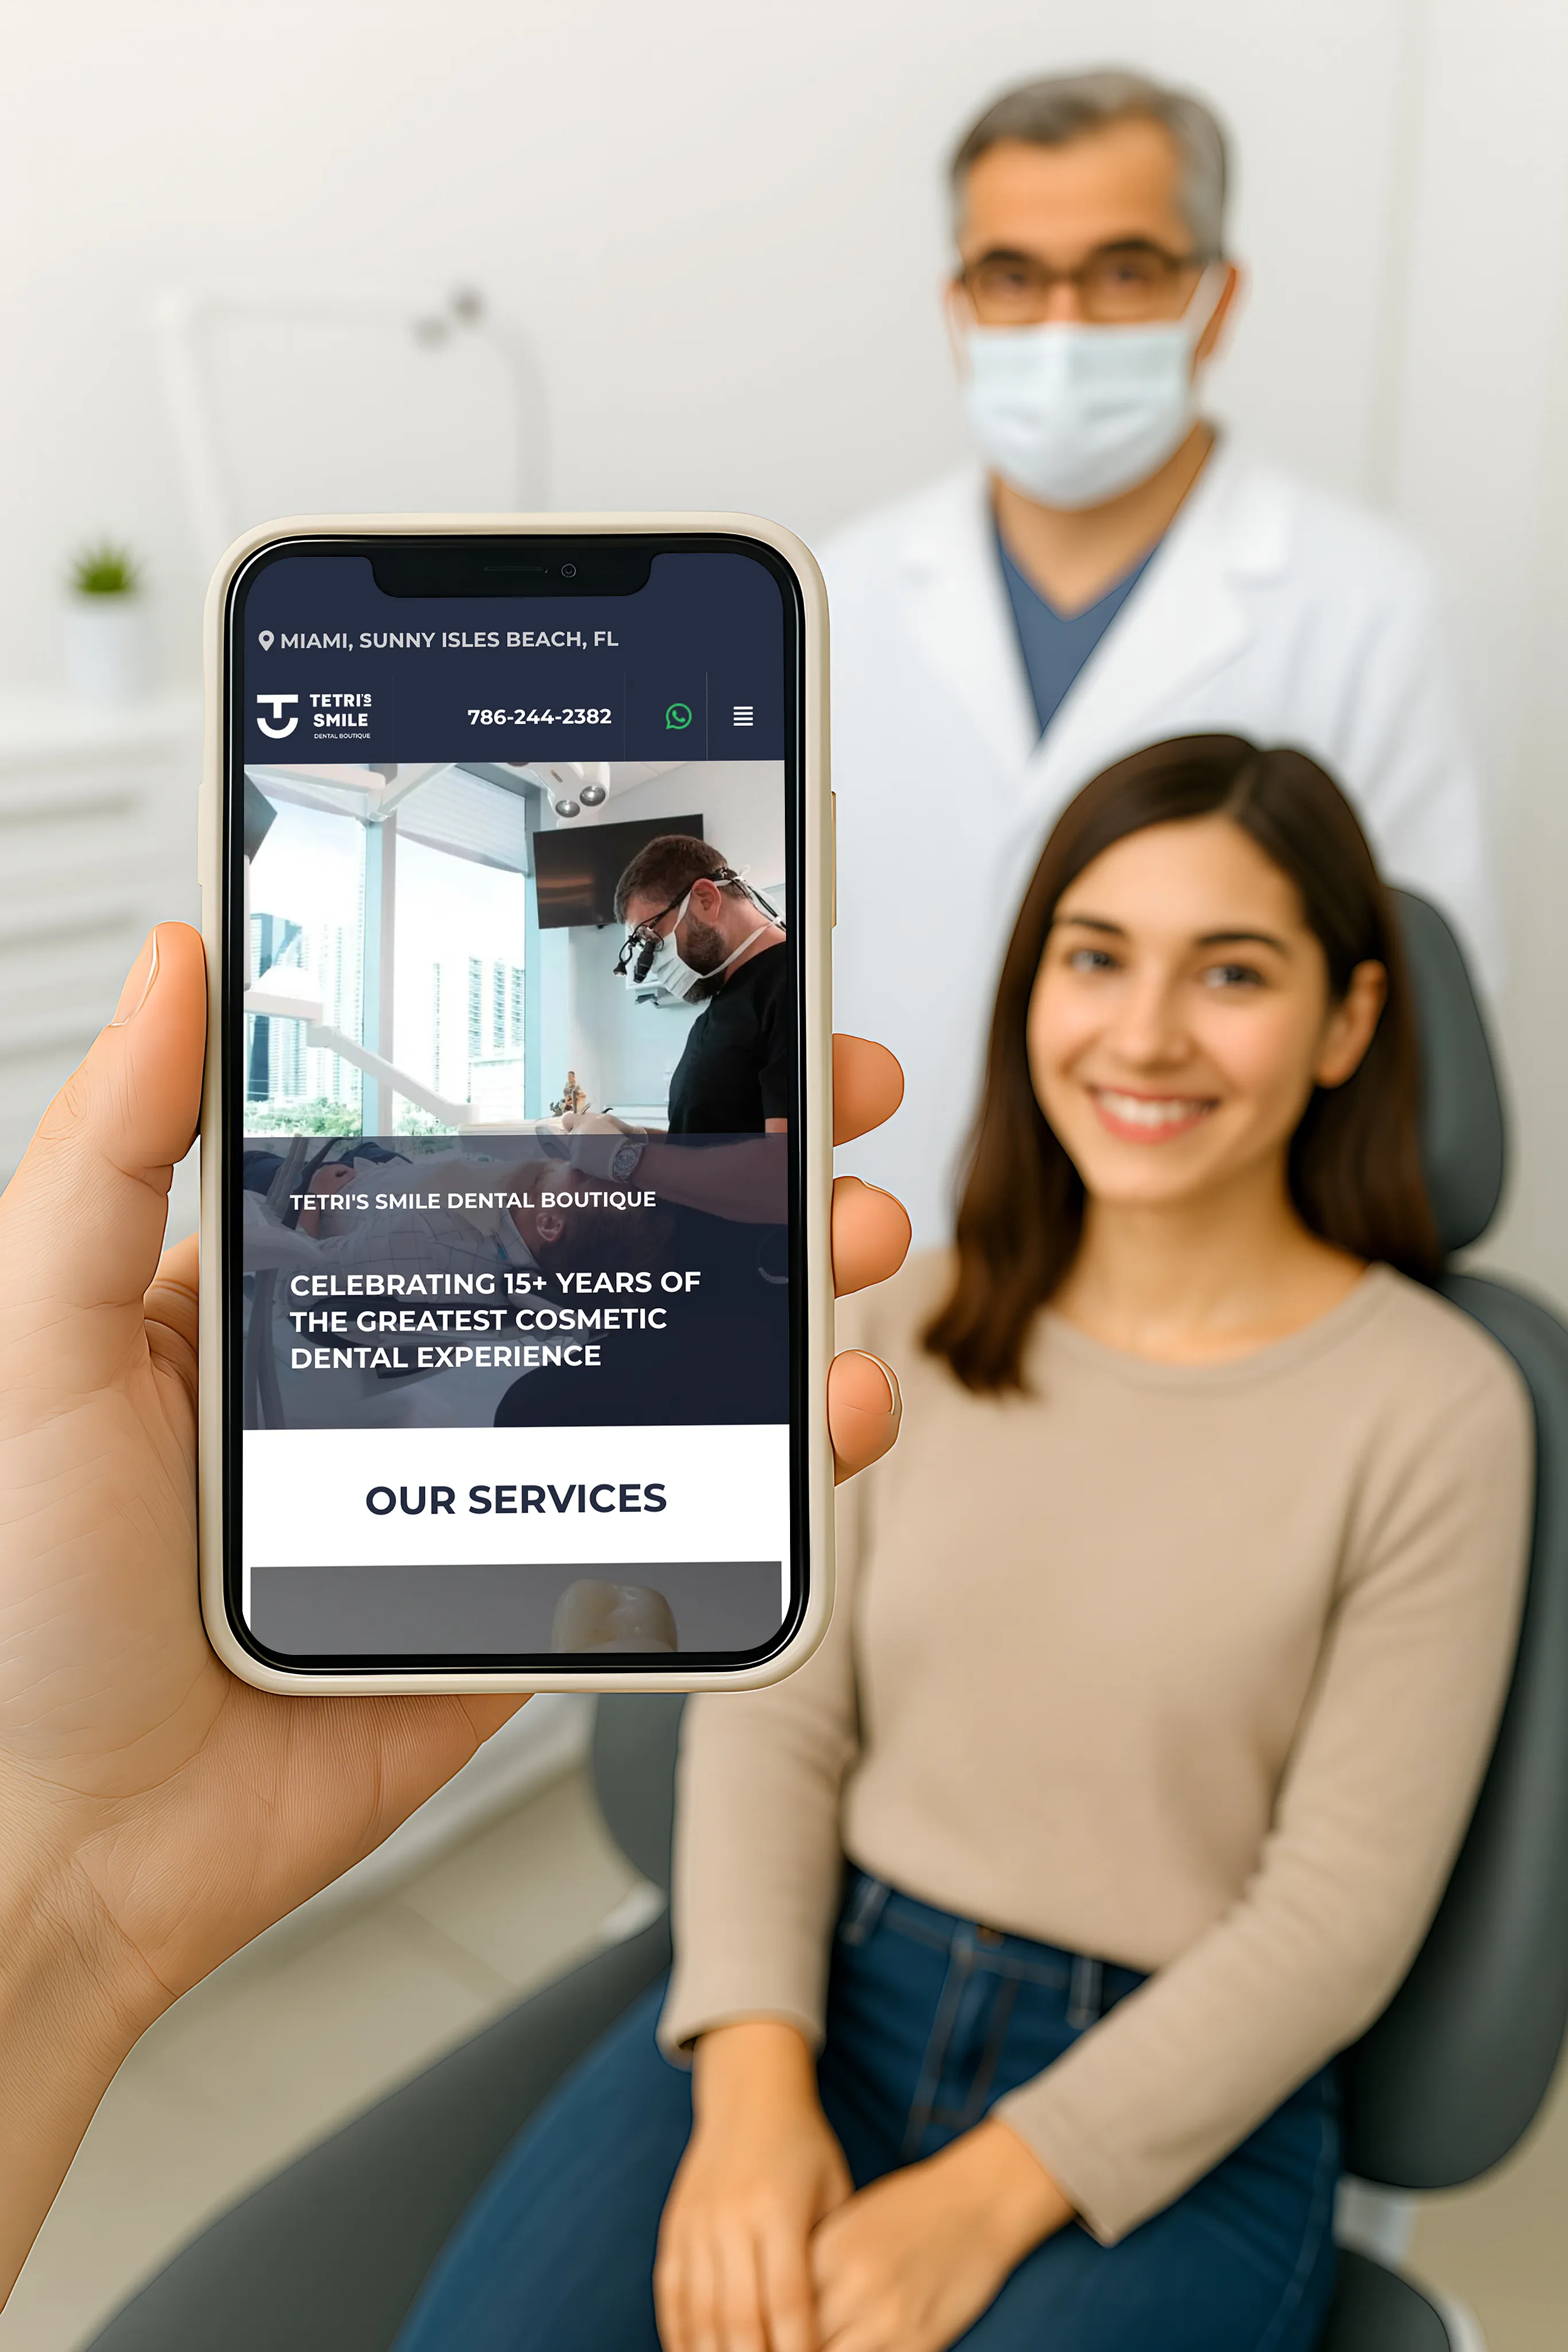
A dental clinic located in Sunny Isles Beach tripled its number of patient inquiries through search engine traffic and digital marketing. We started promoting the website from scratch, right after the clinic launched.

Explore our SEO approach — from analysis and audits to content, links, and ads. See how we drive businesses to the top of search results.
We built Nevapallete.cn for China: Hong Kong hosting, Chinese domain, fast loading across regions, and a timely launch.

A wine catalog with 2000+ bottles, smart filters, and selection by volume and vintage. Seamless UX and internal linking for better SEO.

Comprehensive SEO for Annazur beauty salon in Florida: traffic growth, local rankings, site optimization, and increased service bookings.
Dental clinic SEO case: 50-80 target calls/month, top search rankings, and traffic growth since Feb 2023 from content and tech improvements.
WordPress showcase website with catalog for German B2B- storage systems for measuring equipment. User-friendly catalog, shipping calculation, VAT validation.
Do you want your website to do more than just exist? Most likely; you want to bring real people to your website and attract customers to your business. At Webdelo, we know how to make that happen. The SoleaBrickellSpa case study is clear proof of our expertise and effective approach.

From a Website on the Brink of Collapse to 40 Leads in a Weekend
Discover how Webdelo helped a dental clinic with a small, one-page website double its local patient traffic.
Digital marketing for dental clinics: SEO, Google Maps, and targeted ads. Over 15 years of experience—50,000+ views and 4,860 leads monthly. Grow your clinic with Webdelo!

Discover How We Reduced Overloaded Queries from 16,685 to 24 in 1.5 Hours

 We use Cookies